Monday 28 November 2016

Forest Fire in Israel


The forest fire in Israel has been in the news this weekend. After yesterday's post, on how Climate Change is enabling more extreme forest fires, I think it is important to show that this is a problem happening now, and is affecting many.

In the past week in the Jerusalem Hills area alone, fires have destroyed > 1,250 acres of forest, and as of last night, the firefighters were still battling blazes. The number of forest fires in Israel have not risen in recent years, in fact over the past two years they have been declining. However, the magnitude of these fires in the past few years is unprecedented. This change has been linked to climate change:
"Winter is beginning later, and the months of November and December have become very dry, with strong winds. Continuous dry, strong winds, not only dry the laundry, but also the vegetations, and turns it into highly flammable material".
Israel is not the only place to be affected by Forest fires in the past week:

  • Peru's forest's are being affected by fires
  • Today there are 24 large wildfires currently burning throughout the Southern United States totalling > 130,000 acres


Saturday 26 November 2016

Climate Change Setting the Forests Alight?

Wildfires 


Wildfire are typically started accidentally by humans, or by natural causes such as lightening. These 'ignition' events start the fire, however, do not have a major impact on the scale of the fire. It is climate conditions that largely determines the scale ie. precipitation and temperature. The amount of vegetation is also an important factor (Abatzoglou, 2016).

As areas, have become warmer and drier due to climate change, there has seen an increase wildfires.

Is this climate change?


How does warming temperatures increase wildfire risk?

  • Longer fire seasons due to earlier spring snow melt. Summer heat builds up more quickly, and warm conditions extend further into fall.
  • Drier conditions will increase the probability of a fire occurring. Higher temperatures, will increase rates of evaporation, and increase wildfire risk areas, where there is lower rates of precipitation.
  • Increased frequency of lightning is expected as thunderstorms become more severe.
  • More fuel for forest fires through increased insect infestation such as the Mountain pine beetle, from higher temperatures, which results in more dead and high combustible trees.

Future global projections


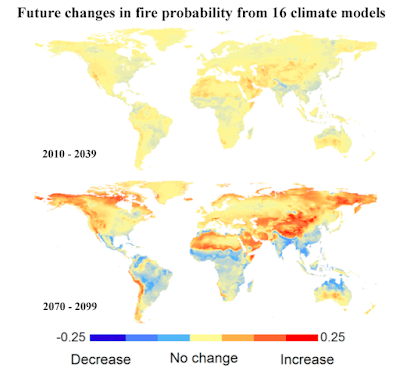
Figure 1: Predicted fractional change in fire probability for the period 2010-20139 and 2070-2099 for the average of sixteen climate models used for the 2007 IPCC report

Large increases in fires are expected over the globe by the end of this century. For the 2010-2039 period, models predict that 8% of the world will see a decrease in forest fires, whereas 38% will see increases. The models are however, too uncertain to predict fire probability for the other 54%. The decreases are mainly concentrated in the tropics and sub-tropics, and the increase in fires will be predominantly in the biomes with already warm climates. For the 2070-2099 period the magnitude and agreement in the direction of change increases substantially. The models agree that 20% of earth will see decreases, and 62% increases, and models are uncertain for 18% of land areas. The decreases will mainly be in the tropics, and the mid- to high-latitudes are to see increases (Moritz, 2012).

The authors found that future fires in many areas will be primarily driven by air moisture availability. Forests in the boreal region are one of the most vulnerable to projected increases in fires. Russian and Canadian boreal forests are at increasing risk due to rapid temperature increases (stocks, 1998), as well as much of Scandinavia (Kelly, 2013).  In the U.S, the regions which are at most risk from increased fires are the tundra regions of Northern Alaska, and the West, with Arizona and Colorado (Moitz, 2012).

Western United States


Earlier this year, a study was published in the Journal Proceedings of the National Academy of Sciences, called 'Impact of Anthropogenic climate change on wildfire across Western US forest'.  This study says that human- induced climate change has doubled the amount of area that is affected by forest fires in Western US, in the last 30 years. Due to increased temperatures, which is turning many areas semi- arid and arid, wildfires are spreading across an additional 16,000 sq miles, than they would have otherwise. 

The main cause of increase forest fires is attributed to warmer temperatures drying the land, by removing moisture out of plants, trees, dead vegetation, the ground and soil, as warmer air can hold more moisture. Temperature increases, resulting in a drying effect is evident in the rise of more fires. However, the study does state that climate change is not the only factor causing increasing forest fires. Direct human actions, and long- term natural climate oscillations over the pacific ocean, play a role (Abatzoglou, 2016).

With this being said temperatures are increasing at around twice the rate in Western US compared to the global warming average. Therefore, climate change should definitely not be dismissed in how big of a factor it is. With wildfire seasons, number of wildfires, and total area affected by wildfires, there has been rapid increases in the past 30/ 40 years, and the future will only see more of these events.

Economic impacts

Since 2010, 10 forest fires in the US have caused at least US$1 billion in damages each, which is mainly from the loss of homes, infrastructure, and firefighting costs. In 2015 across the whole country, wildfires burned > 10 million acres, this is the highest annual total acreage burned since 1960, when recording began. The costliest fire occurred in California, where > 2,500 structures were destroyed in just 2 wildfires. Here insured loses alone exceeded $1 billion.

Other impacts

Beyond the direct economic impacts, there are many other implications of wildfires. Several public health risks are related to wildfires. Smoke reduces air quality and can cause eye and respiratory illness. The young children and the elderly, are at particular risk. A 2012 study estimated that ~340,000 people die each year from long- term health effects, associated with smoke from forest fires.


Wildfires can have ecological implications, causing ecosystem changes. They also release large amounts of co2, which further add to the GHG's already in the atmosphere, and contribute to more climate change. Furthermore, soot that settles on snow and ice cause them to absorb more heat, and therefore melt faster.

Concluding thoughts


Warmer temperatures are causing forest fires to increase, not only in quantity, but also the amount of land that is being affected. We are also seeing prolonged wildfire seasons. However, it is important to realise, as in all cases that climate change is not the only blame. Forest fires can be naturally occurring, and also can be caused by humans, however, the effects of climate change is making this event much more extreme across the globe. Therefore, mitigation and adaptation efforts need to be adopted and put in place immediately, to reduce the risk of wild fires.

The current change in climate in transforming our landscape, and fire is one of the tools it uses. As temperatures rise, we should expect to see more of it, in more places.

Saturday 19 November 2016

The SuperMoon and Global Warming: A glimpse into the future?

The Rare Supermoon that dominated the skyline, has been a hot topic in this week's news.

The rare supermoon which dominated the skyline for many, presented a natural wonder for many stargazers, however, there are devastating side effects related to this lunar event which has seen high tides and flooding in parts of America.


Last Mondays supermoon meant that the moon has been the closest to the Earth, than it has been in nearly 70 years. A supermoon happens when the full moon coincides with the lunar orb's closest approach to Earth during its orbit. The full lunar dusk appeared 14% bigger and 30% brighter than usual. One of the effects of the supermoon is stronger high tides due to the increase gravitational pull.

Miami, as well as many other areas, saw heavy coastal flooding. The supermoon increased the effect of the seasonal king tides- the highest predicted high tide of the year at a coastal location, which occurs once or twice a year- caused low lying areas to be immersed in water.

According to the New York Times:

"These so-called king tides, are the most blatant example of the interplay between rising  seas and the alignment of the moon, sun and Earth. Even without a drop of rain, some places flood routinely".

Rising Sea Levels

Coastal areas prone to flooding see higher tides monthly due to spring and proxigean tides. When they occur together the impacts are worse, but not catastrophic. If you were to add a third force for example a storm, things can deteriorate very quickly, creating storm surges and inundating low low lying areas.

Now add sea level rise into the picture. One of the main causes of coastal flooding is the rise of sea levels. Sea Level rise is caused primarily by two factors related to global warming (1) melting land ice at the poles; and (2) thermal expansion of seawater as the oceans warm. Tide gauge measurements has shown that sea level has risen by an average of 1.7 ± 0.3mm/ year since the 1950s. However, sea level rise has accelerated especially since the 1990s (Nicholls, 2010) causing the sea levels to rise by 3.4± 0.4mm per year. Since 1993 it has risen 85mm (figure 1).


Figure 1: Global sea level rise 1993-2016

Modelling studies (figure 2) have shown that by 2100 sea level rise will range from 0.57 to 1.10m, with the maximum rate of sea level rise reaching 17mm/year according to the RCP8.5 pathway (Jevrejeva, 2012)

Figure 2: Sea level projections 2100 with RCP scenarios

Risk


'At the UN COP21 climate change summit in Paris December 2015, a target was set to limit global temperature rise to below 2℃'. May 2016, Christian aid released a report 'Act now pay later: protecting a billion people in climate- threatened coastal cities'. They detailed how by 2060 more than 1 billion people will be at risk from rising seas, flooding, extreme weather and storm surges caused by climate change.

The US who is one of the biggest emitters of GHGS, is likely to suffer most from coastal climate change, due to the value of exposed property, business, investment and other assets. 

Miami 

The coastal city this week hit headlines due to flooding. With 4.7 million residents, it is the top 9th city at risk in terms of population, but tops the list in financial terms, with > US$3.5 trillion worth of assets predicted to be exposed to extreme weather and flooding by 2070. Below shows a map (figure 3) of the areas that would be underwater in Miami if sea levels rose by 6 foot, that is 32,986 homes. 


Figure 3: Underwater homes in Miami

The flood this week, is just one of many issues the Miami area has faced because of rising sea levels. A university of Miami study published earlier this year found that flooding from rising tides has increased 400% since 2006. They also found that rising sea levels increased the frequency of rain- induced flooding events by 33%, because the higher sea levels reduced the effectiveness of gravity- based drainage systems. 

Thus in 2014, the city of Miami beach invested at least US$400 million in replacing old gravity based drainage systems with a new pumped-based systems throughout the most flood- prone areas. They are also investing into raising street heights. 

Concluding thoughts

The flood this week was not necessarily directly caused by climate change,  however sea level rise due to warmer temperatures has increased the magnitude of it.

Flooding in Miami is highly predictable, this low-lying area is already prone to flooding, especially due to monthly high tides, its porous limestone geology, and ineffective drainage systems. Therefore, it is not to say that sea level rise is causing flooding, because that is not the case. But climate change has meant that this area has become more susceptible to flooding- 'When it rains it floods', and there is simply more flooding. And this will get worse.

Climate change here is no longer seen as a future threat, and an expensive one it is. Is this a glimpse into the future for the rest of the world?

Saturday 12 November 2016

North East Brazils Drought

Droughts


While Climate Change has increased precipitation in some places- as seen in last week's post, other regions have seen drying trend contributing to drought (Trenberth, 2007). Droughts are not only caused by lack of rainfall, but also increased evaporation from soil and vegetation, associated with warming (Dai, 2011).

There has been a global trend, that has seen an increase in drier, hotter areas and dry regions becoming drier, which can both be traced to human influence. The increase in GHG emissions have contributed significantly to this recent drying, by driving warming over the sea and land (Dai, 2011).

There is considerable disagreement about the concept of drought. In North East Brazil, based on rainfall records meteorologists, dispute some Brazilian scientists and policy makers claims to how long the region has been experiencing drought for (Wilhite, 2009).

Climate change and Drought- NE Brazil


A recent study published this year- 'Drought in NorthEast Brazil- past, present and future' suggests that the droughts which have traditionally affected this region are being worsened by the effects of climate change.


Droughts have been recorded in this region since the Portuguese Colonisation in the early C16th. However, the droughts are getting worse and scientists warn that this could lead to desertification of the region. The latest drought, which began in 2012, is the worst reported for over a century.


Figure 1: Rainfall anomaly (mm month^-1) during the peak rainy season (february- May) in Northeast Brazil from 1951- 2014


ENSO does influence interannual variability in this region. However, of the most recent, only the droughts occurring in 1998, 2002 and 2012 occurred during ENSO years (Figure 1).

This region covers 18% of Brazil's total area and is home to 53 million people. With 34 inhabitants per sq mile, it is the most densely populated semi- arid region in the world. The combination of lower- than- average rainfall and land-use changes due to rapid population growth and increase in economic activity, are exacerbating the impacts of drought.


What does the future hold?


Future climate projections show temperature increases, rainfall reductions, and an increase in the tendency for drought and aridification in this region.

This report's analysis of rainfall, temperature, and dry spell anomalies, confirmed the IPCC (2014) projections of increases in the severity and duration of droughts by late c21st, but low confidence for the first half of the century (Figure 2).

figure 2: Past and Projected temperature and precipitation change 


The author says

 "Climate change will extract a heavy price from the northeast. Is it inevitable? Today there is only one certainty. In the future, there will be longer and hotter drought periods."
"Climate projections generated by the climate model suggest that from now on, more severe and prolonged droughts will be the rule, not the exception."
The projected future in NE Brazil of increasing frequency and length of dry spells, and droughts, has created much concern among natural resource managers, farmers, development specialists, researchers, and policymakers.  Water security, Food security, and Energy security, are at further risk due to these changes, which will in turn affect the sustainable development of this region.

This report references (Wilhite, 2014), that the current drought in NE Brazil has:
"Sparked a new round of discussions on improving drought policy and resilience to drought, as well as management at the federal and state levels in the region"
However, it is argued by Jan Rocha:
"The alarming but very possible scenario is almost completely ignored by politicians, who over the decades have used the droughts to further their own careers."

Concluding thoughts

Although drought and aridification on their own do not cause land degradation, they can make the land more vulnerable to human- induced degradation. Therefore, if not already, climate change will become the biggest challenge for North East Brazil, intensifying this environmental phenomenon. Therefore a number of obstacles will need to be identified and dealt with through appropriate policies, in order to reduce the risk for local people.

Wednesday 9 November 2016

Trump: A NEW PLANETARY DISASTER?

"We're going to cancel the Paris climate agreement- unbelievable- and stop all payments of the United States dollars to UN global warming programs."


Donald Trump who believes that climate change is a Chinese conspiracy to make US manufacturing non-competitive is now the new PRESIDENT OF THE UNITED STATES!


What does this mean for the future?


Figure 1: Past and future projections of US carbon emissions based on US presidency

As the world looks to reduce carbon emissions following the 2015 Paris Agreement on Climate change, Lux Research finds that, Trumps presidency could see these emissions rising again (Figure 1). Trumps vision includes greater production of fossil fuels- in particular coal, cancelling Obama's clean power plan and withdrawal from the Paris agreement.

With the United States, already at number 2, of top emitters of GHGS (WRI, 2014) . Trumps presidency could see an increase in the utilisation of coal power stations, dependency on other GHGs, and a reduction in renewables. This will cause unprecedented increases in temperature, and, in turn, have further massive global implications on extreme weather.

Saturday 5 November 2016

More rain?

Precipitation changing with climate change

Figure 1: Observed change in annual precipitation over land 

Precipitation is the general term for rainfall, snowfall and other forms of frozen or liquid water falling from the clouds. The type of precipitation that occurs is greatly dependent on the temperature and weather at the time (IPCC, 2007).

Precipitation varies from year to year, constantly changing the amount, intensity, frequency and types. Precipitation has increased in many regions of the world and decreased in others (figure 1), with little or no net change in the total amount of precipitation (Trenberth , 2011).


Observed changes

'Precipitation has increased in the Eastern parts of North and South America, Northern Europe, and Northern and Central Asia. Precipitation decreases have been observed in the sub tropics and the tropics outside of the monsoon trough, namely the Sahel, the Mediterranean, Southern Africa and Southern Asia' (Trenberth, 2007).

Some areas have experienced widening swings between the two precipitation extremes. An example of this is the East African region. This region typically has a bi-modal annual rainfall cycle. The past 30 years has seen a gradual drying of the long rain season, and increased rainfall in the short rain season (figure 2). To read more on this Visit my Blog Post this week on Climate Change in East Africa. 


Figure 2: Percent of normal precipitation in East Africa, 2011
Source: NOAA Climate Prediction Center via Weather Underground

Can this not be natural variability?


Local and regional changes in precipitation largely depend on atmospheric circulation patterns determined by El Nino, the North Atlantic Oscillation and other patterns of variability.  Trenberth (2010) found that the global patterns of variations are dominated by large-scale patterns of change in precipitation associated with ENSO. A study based on the rainfall trends in the Philippines between 1951- 2010 found that the statistically significant drier conditions are related to El Nino, and the statistically significant wetter conditions are related to La Nina. The results suggested a trend of the dry season (January- March) becoming drier and the west season (July- September) becoming wetter.

Due to the natural variability in rainfall, it can be difficult to detect changes in rainfall patterns. Not only does El Nino make wet areas water, it also contracts storm tracks towards the equator, and that is the opposite effect of climate change. So, to separate the signal of climate change from natural variability, Marvel (2013) looked for both increased rainfall in wet areas and a shift in storm tracks away from the equator, which cannot happen naturally. This is exactly what they found.

Therefore, as also found in Scott (2010), natural variability arguably cannot explain the observed intensity and distributional changes in precipitation. Rather these are consistent with a combination of natural factors and human influence.

How is climate change affecting Rainfall?

There is more and more evidence that human- induced climate change, is changing the hydrological cycle, especially extreme weather events.

A study on the Increased record- breaking precipitation events under global warming has shown that in 'the last 3 decades the number of record breaking events has significantly increased in the global mean' (Figure 3). They found that there was 12% more of these events from 1981- 2010, compared to a scenario without global warming. In 2010 there was a 26% chance that the increase rainfall events were caused by climate change.

Southeast Asia had an increase of up to 56%, Europe 31% and Central United States 24%.

Figure 3:  Annual observed record-breaking anomaly between 1981 and 2010

What is the relationship between rainfall and temperature?


The Clausius- Clapeyron equation is a good predictor for changes in extreme rainfall intensities- The higher the temperature of the air, the higher its potential to hold more moisture. This greater amount of moisture in the air translates into stronger downpours. The relationship predicts a 7% increase in water vapour per ℃ of warming. Not only does increased moisture mean heavier rainfall, but also less frequent and shorter rains, as it takes longer to recharge the atmosphere with moisture.


The future?

Climate models suggest that increasing GHG's in the atmosphere will change precipitation patterns in 2 main ways: 

  1. There will be a shift in a strengthening of existing precipitation patterns- The wet areas will get wetter and the dry areas will get drier.
  2. Changes in atmospheric circulation- Storm tracks will move away from the equator and towards the poles

IPCC Models

IPCC models indicate that with a warmer climate, precipitation will increase in the areas of regional tropical precipitation maxima. Specifically over the tropical pacific, with general decreases in the sub-tropics, and increases at high latitudes (IPCC, 2007).

Globally the average mean water vapour, evaporation and precipitation are projected to increase.

Figure 4:Changes in extremes based on multi-model simulations from nine global coupled climate models


As shown in Figure 4, intensity of precipitation events is projected to increase, particularly in tropical and high latitude areas. where there are general increases in mean precipitation. Even in areas where mean precipitation decreases, precipitation intensity is projected to increase, with variability. The mid- continental regions are at great risk of drought due to the tendency for drying during summer.

Concluding thoughts

Rainfall patterns are constantly changing; however increasing temperatures has meant that these precipitation events are becoming more and more extreme. Extreme precipitation events are typically defined as floods and droughts. Floods are associated with extremes in rainfall, while droughts are associated with a lack of precipitation and often very high temperatures (Trenberth, 2011). Todays post aimed to provide an insight into how rainfall patterns have changed and how they are projected to change in the future. 

Next week's blog will focus on how these changes have affected North East Brazil in terms of Drought.